
CHUM crosshole logging for csl testing
software snapshots
You'll soon realize that we take simplicity and usability rather seriously.
Yeh, sure... Everyone says that... but in Piletest we declared ease of use as our #1 objective and we will go extreme, just to save you a couple of seconds on an operation performed on-site. As a result of these efforts, you can learn to use our systems by yourself in a few hours. Saving those training days required by other, harder to use, systems. And saving hours in the field.
The main page of CHUM
-
Just like the familiar Windows interface, you can view piles by date, name, etc. In addition, your piles can be arranged by their physical x-y location within the site, this site-plan view can be zoomed in and out and moved around, all with a single click.
-
There is no limit to the number of piles you can keep, pile names, or in fact, to anything else.
-
Your project may be divided into subsites, each with its own site plan.
-
Double click on an existing pile or tap on the big + to edit, re-test or add a pile, all these operations are done with a single, intuitive wizard described next
CHUM's "Test Wizard"
-
The wizard naturally leads you through the ultrasonic test stages. It also verifies that no step is skipped
-
CHUM's ergonomic user interface lets you define sections quickly and positively.
-
Only three clicks, and you can start logging
CHUM First Arrival Time (FAT) Picking
-
CHUM automatically picks the FAT for all recorded pulses using one of several available algorithms.
-
FAT can be overridden by the user for individual pulses by a single mouse click
-
A quick navigation graph (on left) lets you quickly locate and jump to problematic areas
CHUM's output
-
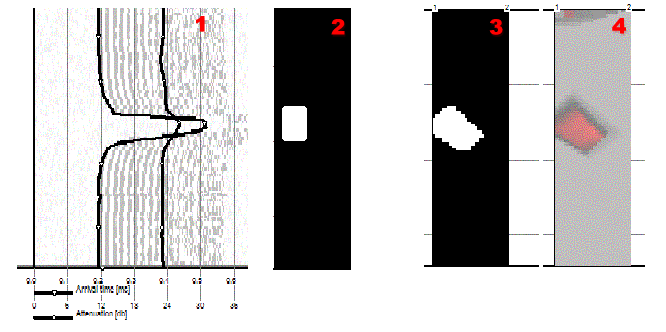
CHUM's results can be presented in many methods, ranging from the traditional 1-Dimensional plot to the intuitive, 2-Dimensional tomography.
-
Line plot (Energy/Velocity/Attenuation/FAT) with an optional waterfall watermark background
CHUM 3D tomography (Optional software)
-
Data from all sections is combined to calculate velocities within the pile's volume.
-
Zoom, Rotate, Tilt, Pane, Slice and Report - all with an intuitive interface made especially for viewing piles
-
Full details about CHUM 3D Tomography here


Presenting CHUM csl test output: waterfall (gray) with FAT (red) and Relative Energy - RE (blue)
Left sidebar in green, yellow, red presents severity according to DFI crosshole csl testing rating criteria

FAT picking screen
Points on the left Signal on the right

Above: 2D Tomography is CHUM standard to collect tomography data for 3D view in the snapshot below
